Showing posts with label sample. Show all posts

Tuesday, May 08, 2007

Carbon Sequestration for Farm, Forest Income

The New York Times has an article about selling carbon credit through the Chicago Climate Exchange (CCX).:

An acre of pine forest captures and holds one to two metric tons of carbon dioxide per year, which it uses for photosynthesis. Untilled cropland holds a third of a ton of carbon per acre, and rangeland holds up to a fifth of a ton. The sequestered carbon dioxide is measured by soil tests before and after the planting.

Carbon dioxide credits now sell for about $4 a metric ton. Mandatory restrictions, experts say, could increase the price to $12 or higher. In Europe, the cost of a credit sold for sequestering carbon dioxide has reached $20, and even $30, a ton.
The market for carbon credits seems to hover between $3 and $4. A review of past CCX newsletters reveals sporadic volume, with common fluctuations of $0.50 to $0.75 per metric ton per month. The New York Times article suggests that biological sequestration will ultimately be replaced with geological sequestration. Expectations of sustaining $20 or $30 a ton seem unrealistic.

$3-$4 is far better than the $0.25 that the Confederated Tribes of the Colville Reservation in Washington received for forested land in the 1990s.

The Tri-Societies' science policy blog has a post about Farming Carbon:
Currently, farmers who wish to profit from the sequestration potential of their soils can sell carbon credits on the (CCX).
Science is needed to better quantify the carbon flux and carbon sinks.
At present, aggregators don't attempt to gauge the carbon impact of individual farms nor do they quantify counterbalancing emissions of traces gases. Hopefully, ASA/CSSA/SSSA members can play a constructive role in the CCX, providing the scientific basis on which aggregators will improve their climate accounting.
I would like to see more discussion on the nuts and bolts of accounting and verification.


Flickr Source: George sampling 3/2/07 ESA Common

Friday, February 23, 2007

My Interesting Experience With Biosolids

It's May 5, 2005 on a biosolids research plot somewhere between Kennewick WA and Umatilla OR . If you can use either a link to Google Maps or a Google Earth kmz file, the plots start 250' S, 150' E of the fence line and extend to 650' S, 425' E. The aerial photos Google has up as I post this were evidently taken before our field visit, probably in late winter (January?) 2005. The dark E/W swaths Google shows would be annual ryegrass (Lolium multifloruminvasive winter rye (Secale cereale) growing better than normal in areas which received aggressive application of municipal biosolids. Application was in April, 20042003.

The fellow in the distance is Tom Duebendorfer (Elmira, ID), botanist extraordinaire. Tom is carrying the quadrat to the west end of the application swath south of the one I am in. I am following about 20 minutes behind him. The wire flags (pink) are randomized sample points down the middle of the application swath. That's my soil sampler in the foreground, a Viehmeyer probe. It's a lot easier to get in than it is to get back out. The astute observers among you will have already noticed that the grass in the plot isn't looking so good: it is thick, brown and stubby whereas Tom is walking in a taller but thinner stand of green grass.

The biosolids killed the grass, but how? My thinking is that it is not a simple toxic effect. Impaired growth or necrosis would have expressed itself soon after the April 20042003 application, or prevented stand establishment at the beginning of the 2004 and 2005 season. Instead we had brief lush growth, almost like a growth hormone effect. 2,4-D works that way, but not on grasses.

My conclusion is that the effect is due to abundant nutrient availability and complex weather patterns unique to 2005. The application rate was designed to promote biomass gains. It worked, and as a result, the grass grew lush and depleted the soil moisture. With abnormally low rainfall in March, by April it had run out of moisture and had to close up shop for the year. April rains came too late for this brown grass, but helped relieve drought stress in the normal areas.

Soil nitrate levels were elevated in the brown areas but not to an alarming degree. Tom didn't see any application affect on the plant species composition, but then we have not formally analyzed the data. Composition effects are probably going to occur after 2005, beyond the scope of the study. I expect we would see an increase in annual ryegrassinvasive winter rye at the expense of other species.

Look close and you will see the ryegrass was still able to produce a fair amount of seed. L. multiflorumS. cereale is an invasive species, and was the only component in the system that really seemed to benefit from the aggressive biosolids rates to a degree that increased it's longterm competitive potential. I can think of any number of invasive species that would respond similarly.

As an aside, it is unlikely that Tom and I will be preparing a formal report based on the data. The sludge hauling client went bankrupt shortly after that May 2005 sampling. The study was a condition of satisfying a permit violation. Outside of that original context, it falls off both our urgency/importance project matrices.

Corrections: Application was in 2003, not 2004. Ryegrasss is winter rye, secale cereale, not annual ryegrass lolium multiflorum.

Technorati Tags:

Wednesday, January 10, 2007

My 2007 Field Season Begins

This week I field validated my hyporheic confinement hypothesis for a site I have been working on.

I had been out mapping wetlands and characterizing a system of ditches and stream-like features. Lucky for me, a chinook was blowing: soil thawed sufficiently to be observed each afternoon. With not-normal effects on vegetation and soil chemistry from seasonal saturation by a nearby irrigation ditch, I suspect these two particular wetlands would delineate smaller, jurisdictionally speaking, come the growing season in March. But I don't know for certain. The combination of river and irrigation induced hydrology can be confounding.

Many of the stream-like ditches used at the site to accommodate irrigation water and return flows were dry. For the ones that had flow I had a devil of a time getting into them safely to measure their cross sectional profile. Prior to my client's purchase for a residential/golf course project, the property was used to run a cow/calf operation. Much of the lower ditch (15 - 30 feet across) has 20 plus inches of anaerobic mud and manure, a sure recipe for disaster for the hip wader approach. The occasional gravel bar saved me from having to pontoon for my data.

The ditches are running with mostly hyporheic/phreatic Yakima River water. I say mostly, because some snowmelt was running in a small ditch onto the site from the upland terrace onto the floodplain. The Yakima is 1000 feet away and was running near bank-full. The ditches are running a few inches below the ordinary high water scour line, and I feel certain the two hydrologies are connected.


The concept that hyporheic/phreatic hydrology can reach this far is a challenge for most folks, including my fellow project team members. How can river groundwater hydrology be feeding it when the ditch is higher than the river? The answer lies in subsurface gravel filled channels. Rivers lose and gain the same water repeatedly. In losing reaches, water drops out of the bottom into permeable gravel filled channels. Where these channels are covered with less permeable material, confinement can result in a considerable buildup of gravitational head. Where the gravel channel reaches to the margin of the floodplain, confined water can upwell at considerable distance from the river, and can be confused with irrigation derived groundwater.

In the Yakima Valley, with its 500,000 irrigated acres and its network of leaky canals, irrigation induced seasonal wetlands are common. In the floodplain, upwelling hyporheic/phreatic river water can be masked by irrigation induced hydrology, but only while the canals are full, or recently so. During this January visit, long after irrigation diversions have ceased, there was no mistaking the dominant river-induced hydrology at the site. Especially telling was the water level in an existing stream-like ditch compared with the newly constructed closed ditch intended become its replacement. Closed at the upper end, the upwelling river derived groundwater flowing in the new ditch was higher by 14 inches than the water flowing in the adjacent, topographically upgradient, closer-to-canal, older, connected, irrigation district return flow structure. 14 inches is also consistent with seepage on the bank of the older ditch structure. In the photo these are separated by only 60 feet.

These 2 ditches provide the strongest validation I've seen in the 20 years I have been observing and puzzling over hyporheic confinement and upwelling.


Friday, February 24, 2006

MPOG - Microbial Prospection for Oil and Gas

Microbial Prospectation looks for anomolies in microbial populations. The presence of various groups of methane-, propane- and butane-oxidizing micro-organisms can reliably differentiate between prospective and non-prospective areas, as well as between oil and gas reservoirs. The result of many years of exerience, the success rate exceeds 90%. This stand-alone approach is inexpensive, probably benefiting from recent computational improvements in characterizing microbial genetic characteristics. Makes you wonder what other benefits will accrue from these types of advances.

Read more at Microbial Prospection and Recovery for Oil and Gas

Tip from: OilNetCom Blog

Wednesday, February 01, 2006

Precise common sense II

Elton Robinson expands nicely on the previous post by email:

The variable-rate application of inputs is actually well developed and prospering in Mid-South cotton fields. It works for two reasons. One, we have highly variable soils along the Mississippi River Delta, which in turn creates variable yields. Second, the cotton crop demands intense in-season management for plant growth, insects, weed management, disease and harvest preparation.

Infrared aerial photography and electrical conductivity mapping carts can pick up the variation in soil type when the ground is bare and pick up plant biomass when the crop is growing. Geo-referenced maps generated from the imagery allow the farmer to vary applications of plant growth regulator, defoliants and other inputs during the season based on variability in biomass. For example, the poor-yielding parts of the field will receive less plant growth regulator to allow plants to catch up with the better-yielding parts of the field, which in turn will receiver more plant growth regulator, to prevent vegetative growth. The result is higher yield and lower cost.

The cost to the farmer for the imagery, and variable-rate prescription is $7 per acre. Sprayers can be adapted for variable rate applications for $6,000. The cost of producing cotton is about $500 an acre. A conservative savings in input costs of 10 percent plus a 5 percent increase in yield would put $65 an acre in the farmer’s pocket. If he farms 1,000 acres of cotton, that $65,000, more than enough to pay off the cost of the technology in year one.

The technology is not affordable if there is little variability in the soil, or if a crop (corn, soybeans) does not respond as well to in-season management. I did read your previous blog on VR nitrogen, and agree that it's been very difficult for researchers to show a benefit.

Tuesday, January 31, 2006

Precise common sense

Precision ag implies computer mapped lab data and GPS controlled field equipment. Higher yields, less flying blind and easier farming. The reality is that the expense of data collection, analysis and interpretation can quickly wipeout any added value. Reading this article about variable rate management of cotton, it struck me that common sense and curiosity are the missing ingredients. Elton Robinson with Delta Press reports on cotton producer Kenneth Hood, Mississippi, who attributes his success with variable rate agriculture to, among other things, reliance on aerial photo interpretation, an approach not typical of precision agriculture. Hood says that the “... advantage to imagery is that very little data collection is required, according to Hood, “which is unlike most precision agriculture practices.” Put this experience together with the recent cryptic news on the lukewarm record of precision agriculture in Germany, which I touched on earlier, and what do you get? My sense is that Kenneth Hood is going to have lots of company.

Thursday, January 26, 2006

Product review - new vadose zone research tool moves to farm

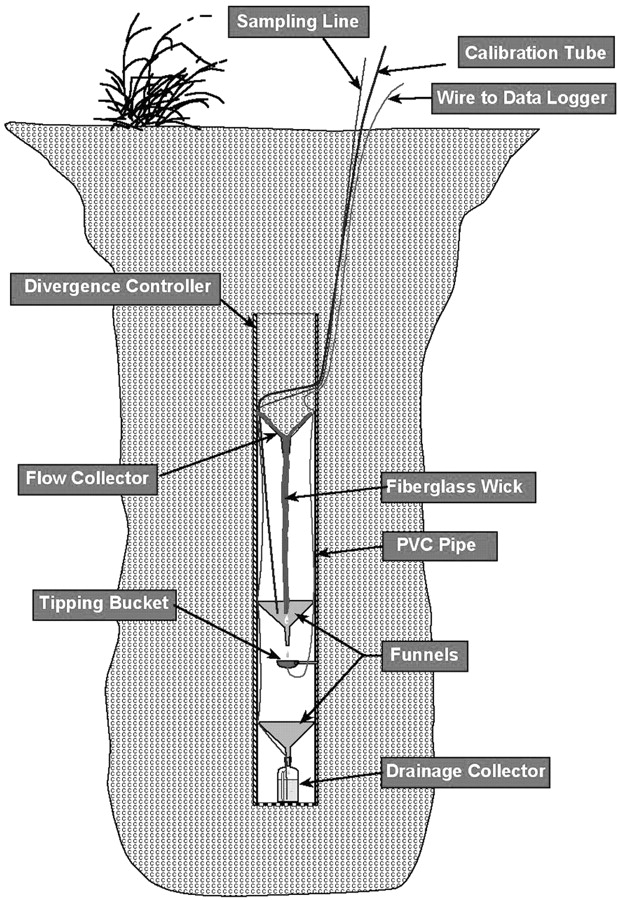
Irrigated farm fields lose water to deep percolation. This groundwater recharge, and what it contains, is difficult to research. This is because sampling tools designed to intercept saturated flow tend to miss unsaturated flow. And visa versa. New technology extracts deep soil moisture using a wick rather than the active suction or gravity.

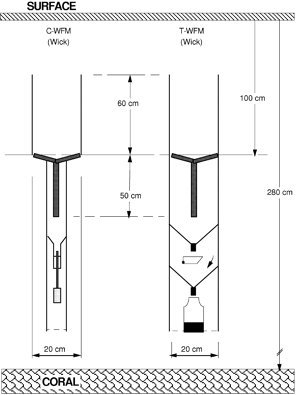
The first wick samplers were passive capillary samplers (PCS). This approach has now evolved into the current water flux meter (WFM) designed recently by Batelle soil scientist Glendon Gee. Two offspring WFM designs are commercially available: the Gee passive capillary sampler drain gauge (Decagon Devices, Pullman WA) and the vadose zone water flux meter (Sledge Sales Consulting, Dayton OR). In a recent journal article, the Decagon device is referred to as a capacitance water flux meter (C-WFM) and the Sledge device is referred to as a tipping-bucket water flux meter (T-WFM). The T-WFM is close to Glendon Gee's designs published in journal articles. The C-WFM was developed by Decagon soil scientist Gaylon Campbell in collaboration with Glendon Gee.

The original PCS devices needed a pit, best dug with a backhoe. Fiberglass wick length and strand size were calibrated to site specific conditions to prevent oversampling of unsaturated conditions. Today's WFMs can be placed in an auger hole or hand-dug pit. WFM configurations use a standard size and length wick which works for most situations. A recent journal article has an example of an oversampling problem.

There are strong similarities and distinct differences between the two firms. Like Decagon, Sledge maintains strong ties with Glendon Gee. Like Decagon, many of the 200 devices Sledge has produced have been for agricultural research. Compared to Decagon, Sledge is more a hands on, farm service and farm chemical oriented consulting business. With Wayne Sledge, the T-WFM is his flagship product. With Decagon, the C-WFM is a sensible addition, part of an extensive and well supported line of soil and agricultural measurement instrumentation. It appears that Decagon and Sledge have produced a similar number of devices and they are clearly on parallel tracks of success in refining their individual product.

Both firms have supplied most of their instruments to agricultural researchers, farms and clients concerned with water use efficiency and nitrogen use eficiency such as golf courses. There has also been environmental project placements, most often associated with landfill and mine-tailing closure

Decagon has put considerable effort into refining unit capacity to record water flux, less into water sample handling. The larger base of the Sledge unit enhances water sample handling options. Decagon has a stepped design which accommodates hand auguring the deepest portion, shortening installation time. Decagon has an extensive list of complementary devices and highly capable technical support staff. The Sledge unit is substantially lower in price. Choice is good.

Of particular interest in Washington State is wastewater spray field management. As mentioned in a government report: "The Department of Ecology has identified 20 spray field situations where wastewater was [improperly] applied [and conditions] ... led to contamination of groundwater...". This report was discussed here previously.

I spoke with Don Nichols, with Washington Department of Ecology's Water Quality Program, Eastern Regional Office, Spokane, WA. Don has encouraged the installation of WFMs for gathering vadose zone water quality information. Don referred me to Cascade Earth Sciences and Soil Test Farm Consultants for more information.

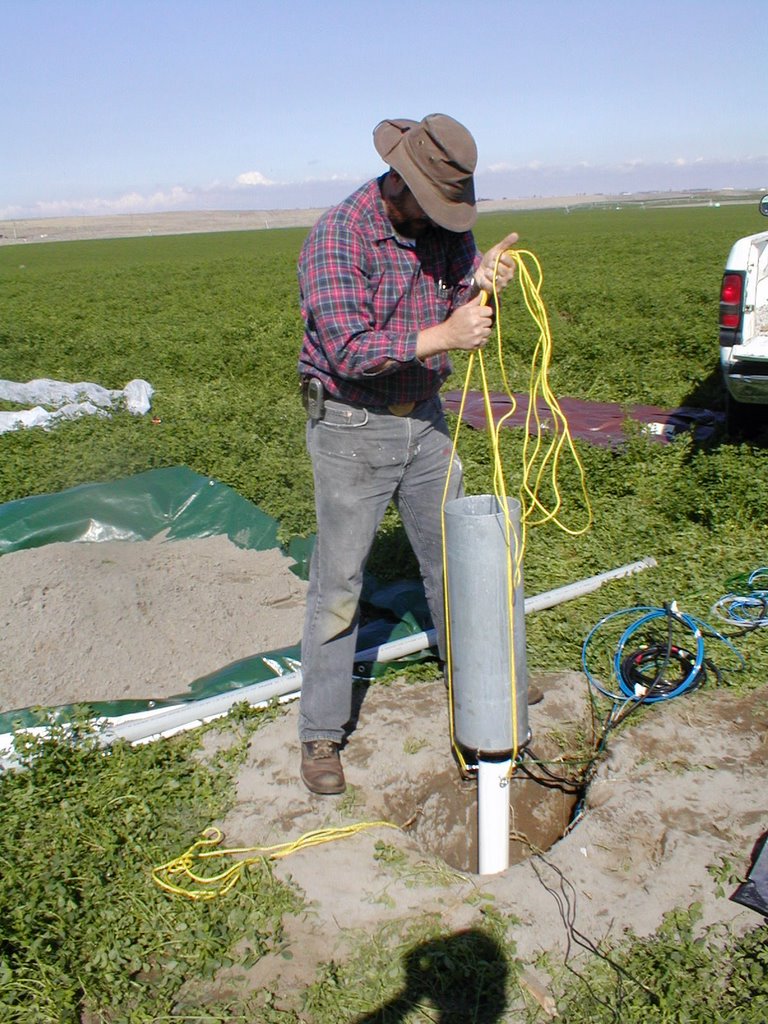
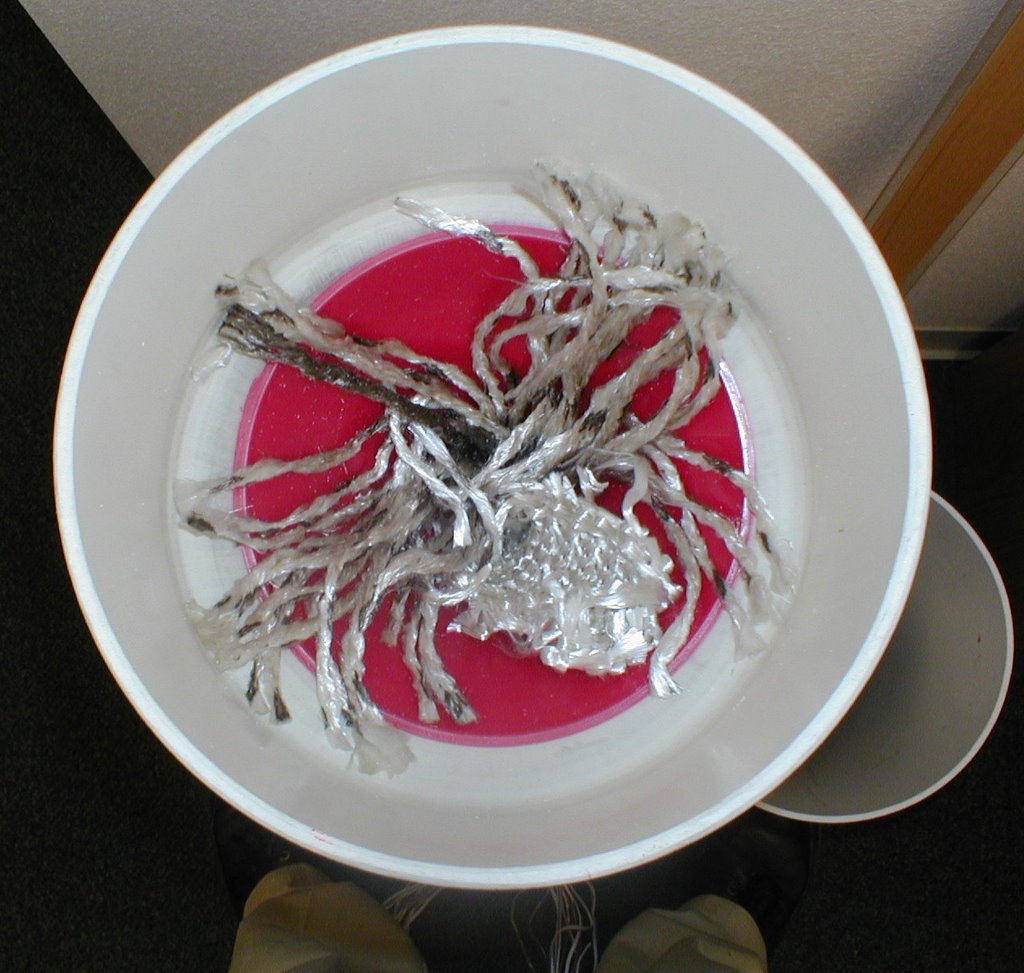
Dan Burgard, soil scientist with Cascade Earth Sciences (CES) in Spokane, WA has installed 7 Decagon C-WFMs in the Pasco, WA area, and 11 Sledge T-WFMs in southern California. CES modified the equipment to enhance sample collection capabilities. (See his photos below)

Dan Nelson, soil scientist with Soiltest Farm Consultants, Inc. in Moses Lake, WA has four Decagon C-WFMs installed in the Moses Lake, WA area. Both had nothing but good things to say about the potential uses of this type of data. Mass balance calculations will demonstrate if target water use efficiency and target nitrogen use efficiency is being achieved. Detailed daily data logs show exactly when percolation occurs. Percolation events observed to date are closely correlated with irrigation and precipitation events and even soil thawing events. As expected with the difference in weight between soil and the field capacity water portion, percolate nitrate and dissolved solids (salts) are several times higher than soil levels above the sample point. The devices are performing as intended.

One question I have is how many devices are needed to achieve statistical confidence in a mass balance calculation? Users independently tend toward sets of 3 units, with singles for spot comparison data. That is a sensible starting point but determining coefficient of variability on selected data would put the results into perspective.


None of the installations have been entirely glitch-free, mostly due to various data logger challenges or site specific soil related factors, such as coarse sands or depth limits. Users of the units are looking forward to continued refinements in data logger compatibility and would like to see costs come down and but give high marks for ease of installation and setup. This and available tech support make sampler units from Sledge and Decagon an attractive alternative to the do-it-yourself installations that predate this equipment.


References:
Brown, K.W., J.C. Thomas, and M.W. Holder. 1986. Development of a capillary wick unsaturated zone water sampler. Coop. Agreement CR812316-01-0. USEPA Environ. Monit. Syst. Lab., Las Vegas, NV.
Cary, J.W. 1968. An instrument for in situ measurements of soil moisture flow and suction. Soil Sci. Soc. Am. Proc. 32:3–5.
Gee, Glendon W., Zhang, Z. Fred, Ward, Andy L. 2003. A Modified Vadose Zone Fluxmeter with Solution Collection Capability Vadose Zone J 2003 2: 627-632 (highwire link) http://highwire.stanford.edu/
Knutson, J.H., and J.S. Selker. 1994. Unsaturated hydraulic conductivities of fiberglass wicks and designing capillary wick pore-water samplers. Soil Sci. Soc. Am. J. 58:721–729.
Selker
, J.S., C.K. Keller, J.T. McCord. 1999. Vadose Zone Processes, Lewis Publishers, ISBN 0-87371-953-0, GB1197.7.S46 1999 [1] [2]
van der Velde, M., Green, S. R., Gee, G. W., Vanclooster, M., Clothier, B. E. Evaluation of Drainage from Passive Suction and Nonsuction Flux Meters in a Volcanic Clay Soil under Tropical Conditions Vadose Zone J 2005 4: 1201-1209 (DOI: 10.2136/vzj2005.0011) (highwire link)


Friday, December 30, 2005

Indicator of Reduction in Soils (IRIS)

The list of activities and structures that don't do so well in reduced conditions is pretty long: septic drain fields, crops and steel underground storage tanks come to mind. On the other hand, reduced conditions are a requirement for jurisdictional wetland designation and constructed wetlands. Beyond that, watching the playoff between various redox gradients in soil is just plain fun.

Pedology and Wetland Soils

B. J. Jenkinson and D. P. Franzmeier*

Dept. of Agronomy, Purdue Univ., Lilly Hall of Life Sciences, 915 W. State St., West Lafayette, IN 47907-2054

* Corresponding author (dfranzme@purdue.edu )

Soil drainage conditions are important to land use decisions. Traditionally, anaerobic conditions induced by poor drainage have been evaluated by observing soil color related to Fe and Mn oxides, using {alpha}, {alpha}-dipyridyl dye, measuring dissolved O2, and measuring EH. We believe that there is further need for a device that is scientifically sound and easy to use. Therefore, our goals were to develop and test a device that mimics natural soil processes, visually indicates soil reduction, and is robust. Our concept was to coat a rod or tube with a colored soil mineral that dissolves on reduction, insert the device into a soil, remove it after a few weeks or longer, and observe if some of the coating had been lost. If the coating was not dissolved, no reduction occurred, but if it was dissolved, reducing conditions must have prevailed. After trying several kinds of coatings and tubes, we chose ferrihydrite (FH) coating on polyvinyl chloride (PVC) pipe. We call the device an Indicator of Reduction in Soils (IRIS). As the study progressed we added semi-quantitative interpretations by measuring depleted areas using a digital camera and image analysis. We tested IRIS tubes in the lab and in soils in Indiana, Minnesota, and North Dakota, and concluded they performed as expected. Reduction rates increased between February and April and were related to increasing soil temperature, turnover (flux) of soil OC, and content (inventory) of OC. Reduction rates decreased after April, presumably because the nutrient supply for microbes decreased.


Abbreviations: Ac, area of FH coating in contact with the soil • Ad, area from which some FH had been depleted • D, percentage of Ac from which some FH had been depleted • DO, dissolved O2 concentration • FH, ferrihydrite • IRIS, indicator(s) of reduction in soils • OC, organic carbon • PVC, polyvinyl chloride • UDD, upper depth of FH depletion


Easy and straightforward. Kind of like the traditional sticking of the toothpick into the banana bread to see if it's done.

Note: I updated this article a few hours after posting the original. If you read the first version, my sympathies. What can I say. Its a gift.

Further Reading:
Redoximorphic Features Powerpoint presentation developed by: Michael Whited, USDA-NRCS - Wetland Science Institute August, 2000. (4.6 MB) (source page )

Technorati Tags: